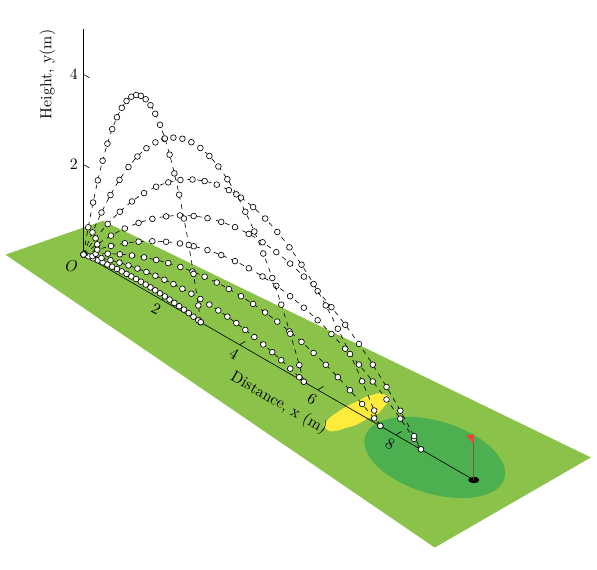
I've been golfing since I could hold a club, and competitively since I was 10. A phenomenon I noticed as I improved is that the source of my mistakes shifted. My added shots were proportionally less due to execution (off target, short, shanks, etc.), and proportionally more about incomplete data about my own game. All of a sudden, my rough heuristic of "I'm about 170 yards out, I'll hit my 7 iron" becomes punishing when I'm 173 yards out and my 7-iron maxes out at 168. Every good golfer experiences this at some point, which motivated the invention of the Trackman. If you watch a range session of a professional golfer you're more likely than not to see them hitting next to a ~$20,000 box that tracks their ball flight and reads back their yardages. However, the price point makes the technology almost completely inaccessible to nonprofessionals.
Today there are definitely cheaper launch monitors ~$500 that provide accurate-enough data (I recently picked up the Garmin R10). The project is more fun if you pretend that they all cost $20,000.
For the final project of my advanced embedded systems class we were tasked with building essentially whatever we wanted on our FPGA boards, as long as it had video output and some input. Most students in our class and in prior years emulate a popular retro video game and write a NES controller module. These projects are cool, especially when you've worked on FPGA projects before and understand how technically difficult simple game emulation can be, however, my partner and I wanted to build something outside of the box. I was simultaneously shopping for a cheap launch monitor at the time, and thought it would be a fun challenge to build one myself, and see how accurate we could get it to the $20,000 dollar options.
Design
Our prototype was constructed using the NEXYS Video board, a GoPro (necessary for high fps), and an intermediate computer (to display the shot tracking data). The NEXYS board costs around $550; the GoPro costs $150. Instead of the GoPro, you could use a high fps raspberry pi camera like this one for around $50. We chose the GoPro because we had it readily available.
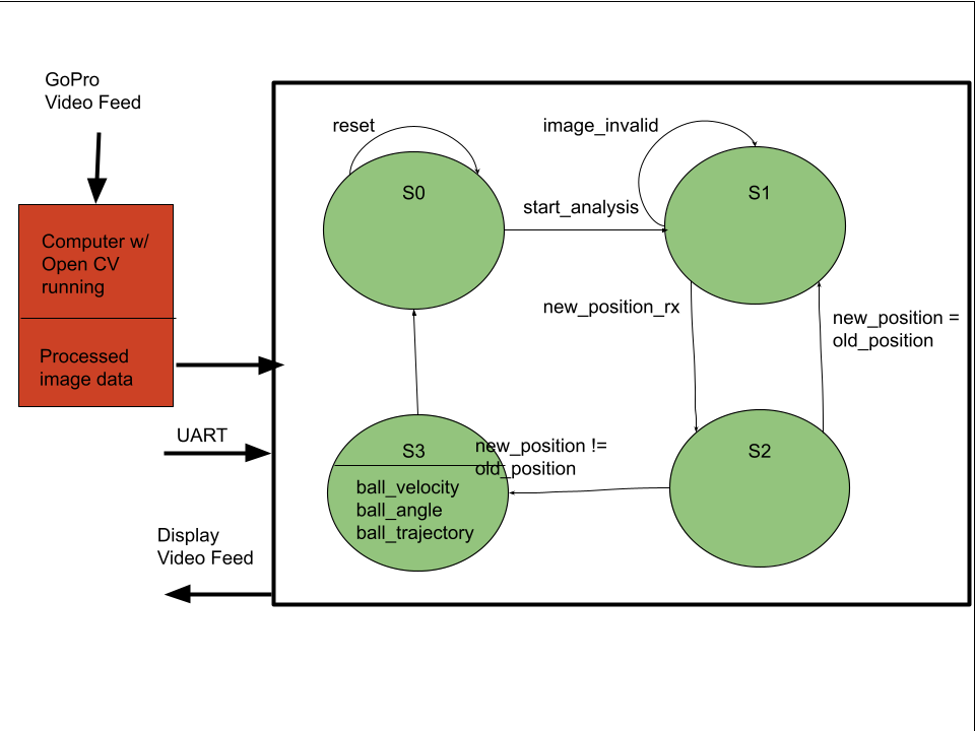
The final system is split into three parts: a OpenCV script that processes the video, UART which reads the signals on the FPGA processor, and the VHDL which draws the results on the video screen. The goal was to have the entire camera feed entirely on FPGA but due to time constraints and class requirements a working system was better than an incomplete pure FPGA implementation.
State Machine for the system
Golf Ball Detection
A view of the CV algorithm in the base state
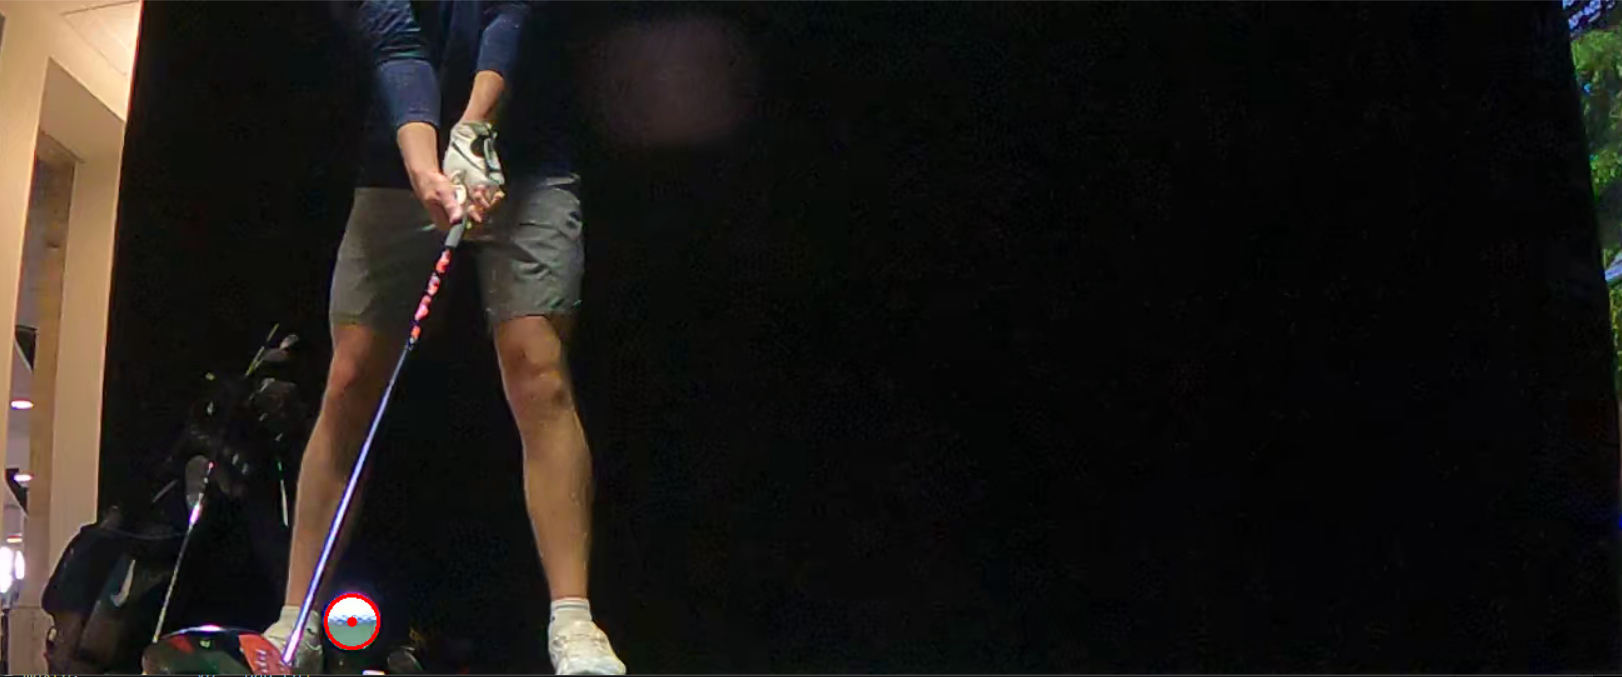
The problem of locating the ball in every frame was more difficult that it sounds. The program is a small finite state machine: RESET, DETECT_BALL, WAIT_SHOT, TRACK, and PROCESS_OUTPUT. In the rest state, the program combines the frames into a median background, converts it to HSV, masks for low-saturation bright pixels, and cleans the mask with morphological opening and closing. A Hough circle transform then finds the ball and gives me its center and radius.
What's useful about getting the radius is we were able to calibrate millimeters-per-pixel without needing a ruler, since the radius of a golf ball is known. Once the ball is found, the program enters the WAIT_SHOT state. In this state, the program only watches the region the ball is in, and when the threshold difference is met, the state machine detects the ball has been hit and begins tracking mode.
The CV algorithm switches to blur detection once the ball moves
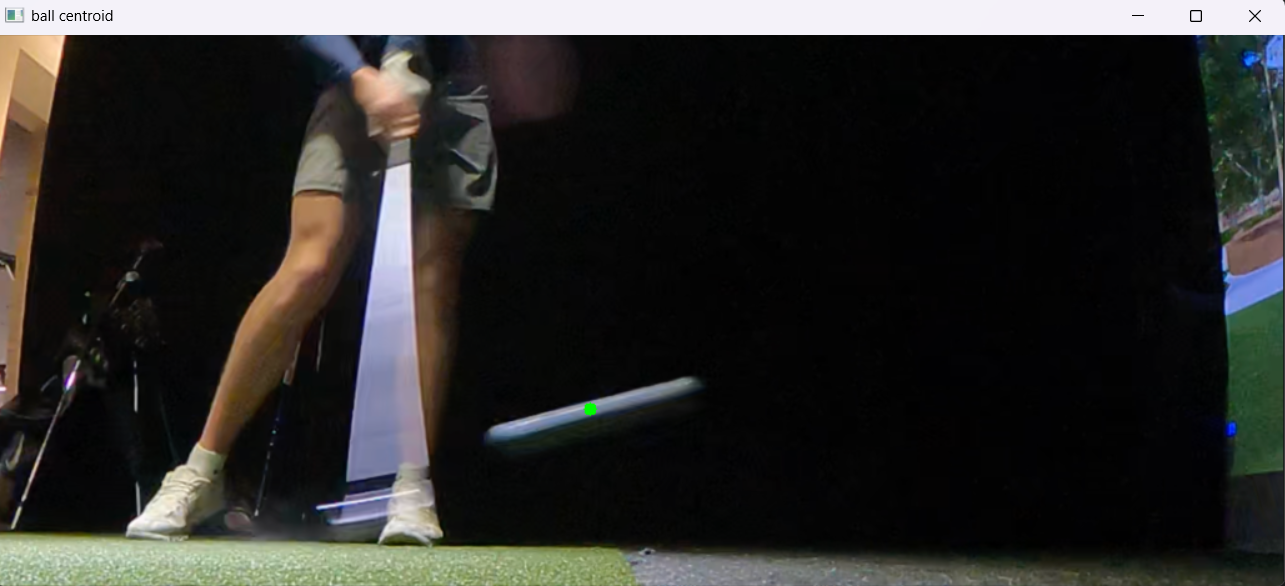
We found early on that the same computer vision detection algorithm that detects the ball in the stationary state is very inaccurate when the ball is moving, which motivated the state machine in the first place. The solution was to look for motion blur. Each frame is compared with the background, combined with a white-pixel mask, and filtered using connected components. Small components are ignored, then the largest reasonable component is assumed to be the ball. Rather than using the middle of the entire streak, I take its rightmost edge and average the Y coordinates at that edge. That gives a more consistent estimate of the leading position of the ball. It records five positions after a shot, converts the pixel offsets into millimeters using the detected ball radius, and formats them into an ASCII message surrounded by < and > characters.
Sending Positions
The laptop sends the five X/Y positions to the Nexys board over a second UART connection at 9600 baud. Each coordinate is padded to four decimal digits, so one shot becomes 40 numeric characters inside the start and end markers. It is not a particularly sophisticated protocol, but it is easy to inspect in a terminal and easy to parse one character at a time on the MicroBlaze.
I first tested receiving one character, then a four-character string, then rejecting anything outside 0–9. After that I wrote a separate Python UART test that sends deliberately simple position values so the FPGA calculations could be debugged without also wondering whether OpenCV had found the wrong white blob.
Shot Calculation
The software within the MicroBlaze uses displacement between frames to calculate the ball's intitial velocity. The displacement is initially millimeters, so we convert to miles per hour, and angle to degrees. We used a standard projectile-motion equation to estimate carry distance. $range = velocity^2 * sin(2 * angle) / g$. We added a small experimental scaling factor that improved accuracy.
Drawing Results
After the calculations, MicroBlaze writes velocity, angle, range, and a display-enable bit into registers on a custom AXI peripheral. The VHDL datapath reads those registers and drives a 640x480 video pipeline. Horizontal and vertical counters generate the pixel coordinates, the VGA logic creates the timing signals, and the RGB data is encoded into TMDS for HDMI output.
I drew the labels and digits directly in VHDL using coordinate comparisons. Each number is effectively a collection of rectangles: if the current row and column fall inside one of the rectangles for a digit, that pixel is turned on. It produces a simple scoreboard-style display for velocity, angle, and range.
The video portion was packaged as custom IP and connected to a MicroBlaze system in Vivado. One UART remains available for a terminal menu, while the other receives measurements from Python. The terminal can toggle the displayed channels, enter test coordinates manually, and print the calculated values, which made it possible to verify each layer separately before attempting the complete demo.
Results
The finished prototype detects a stationary golf ball, notices when it is hit, follows its motion blur for several frames, sends those measurements to the FPGA, and displays ball speed, launch angle, and estimated carry distance over HDMI.
I'm still working on looking for the demo
It did not reach our original stretch goal of performing computer vision directly in VHDL, and the projectile model is intentionally simple. The camera also needs a controlled view with good contrast for the thresholding to behave. Even with those limitations, this project taught me a lot about dividing work between software and hardware, and was unique and fun.